
By Cameron Clark, Dixon Resources Unlimited
As Principal of Data Services at DIXON, I lead our data team and the development of our parking data collection and analysis tools. In my 11 years in the industry, I’ve worked on thousands of parking and mobility studies, collecting data firsthand and managing large field teams using various methods. Those experiences continue to guide how I approach our work, and I’m excited to share what our team has been developing, including a new tool we’ll introduce later in this series.
Collecting accurate parking data efficiently is surprisingly difficult. As technology has become more practical for this work, we’ve found ways to save time, reduce costs, and give agencies better information. In this series, I’ll share lessons from the field and how they’ve shaped the methods and tools we use today.
My first assignment was to build a parking inventory database. Before I could help a city understand whether its parking was full or underused, I needed to know how much usable parking it actually had. That turned out to be more complicated than I expected.
A measuring wheel and 250 block faces
That first project was a parking study tied to the long-debated Burke-Gilman Trail Missing Link in Seattle’s Ballard neighborhood, examining how much parking would be lost under different trail alternatives.
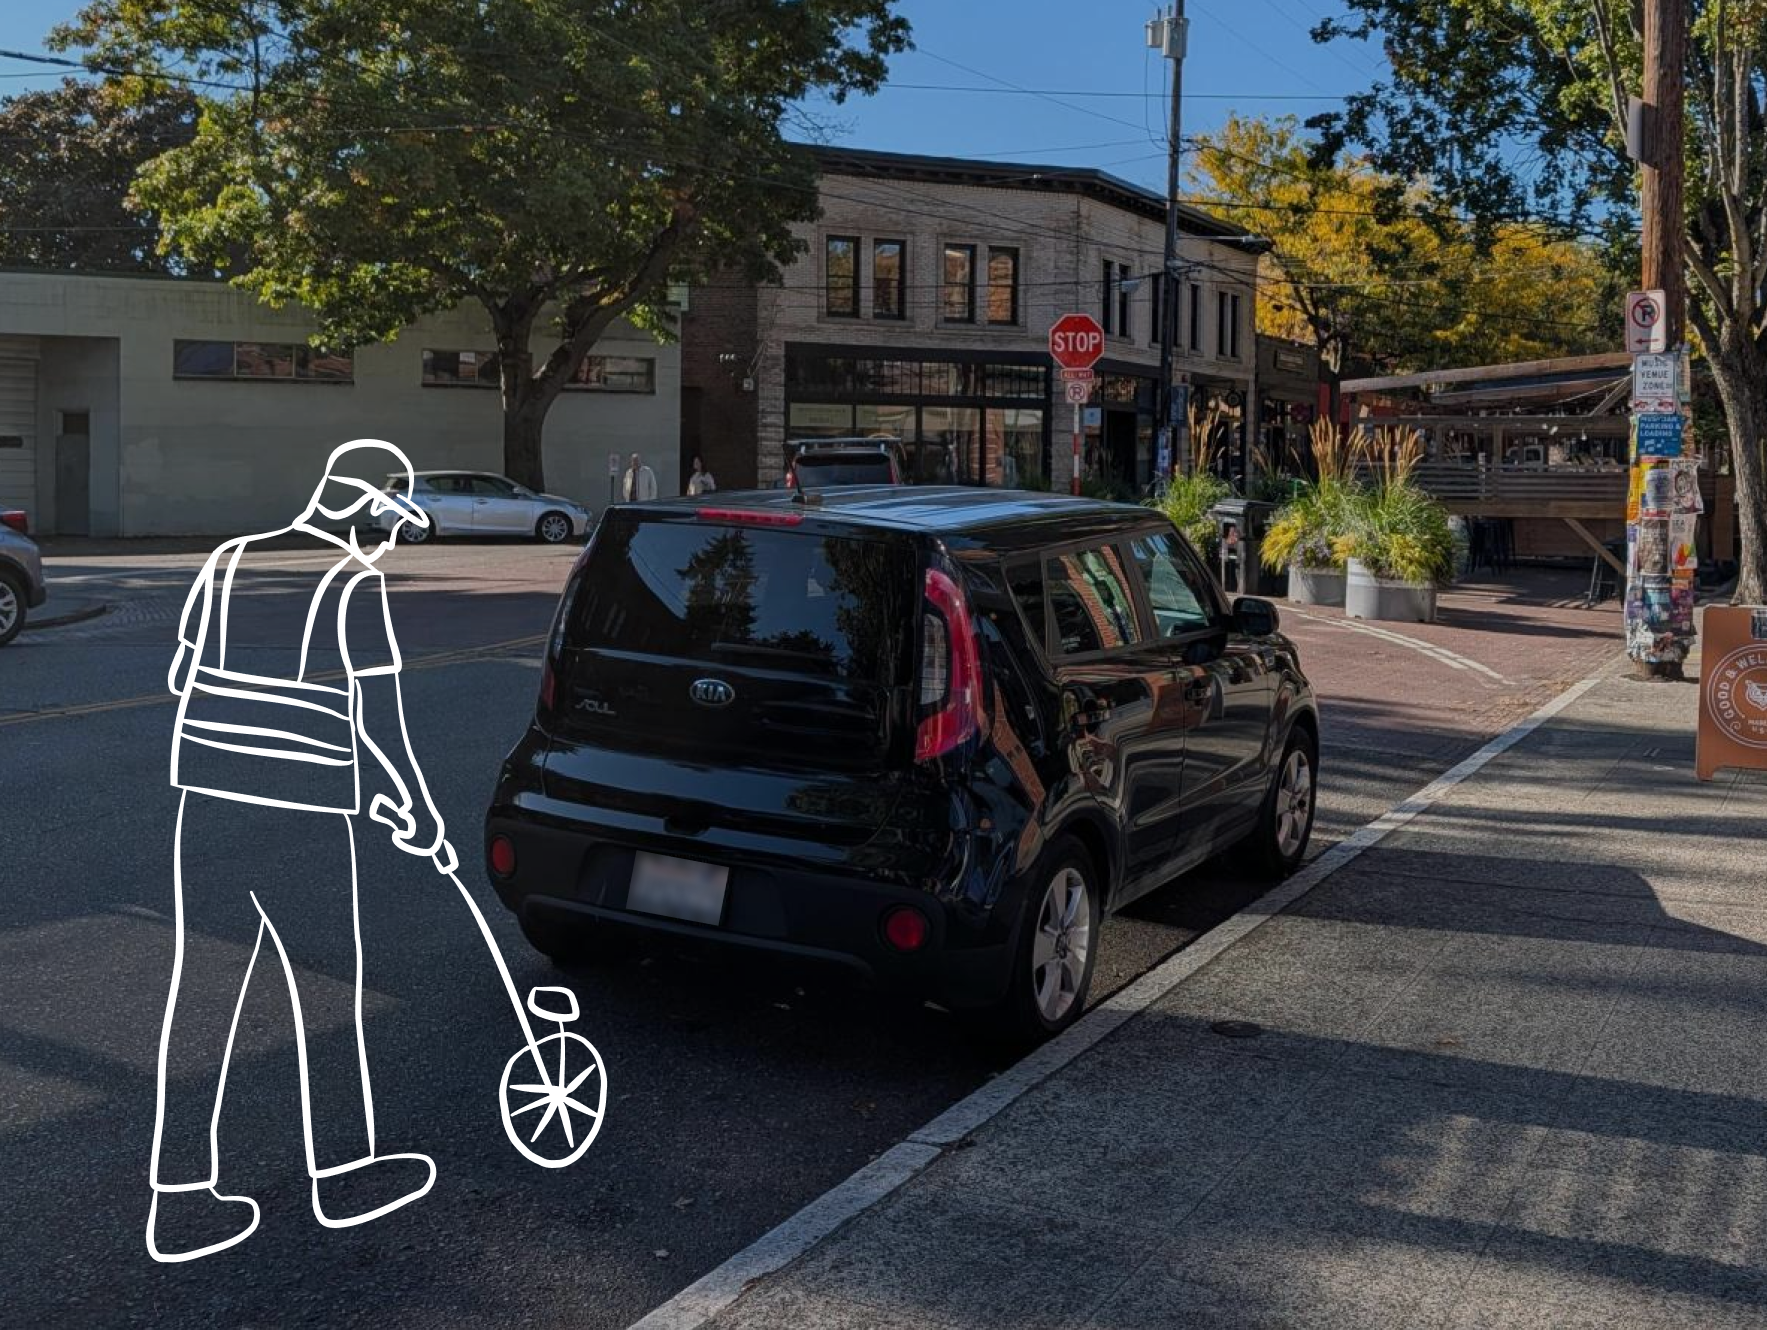
So, there I was: pen, paper, a measuring wheel, and a lot of curb. At set times, I walked the study area recording occupancy. In between counts, I built the inventory by hand, walking each block face, marking curb colors, signs, driveways, alleys, loading areas, restrictions, and segment lengths on a paper form. Depending on the block, that took 10 to 30 minutes per block face and I had roughly 250 of them to collect.
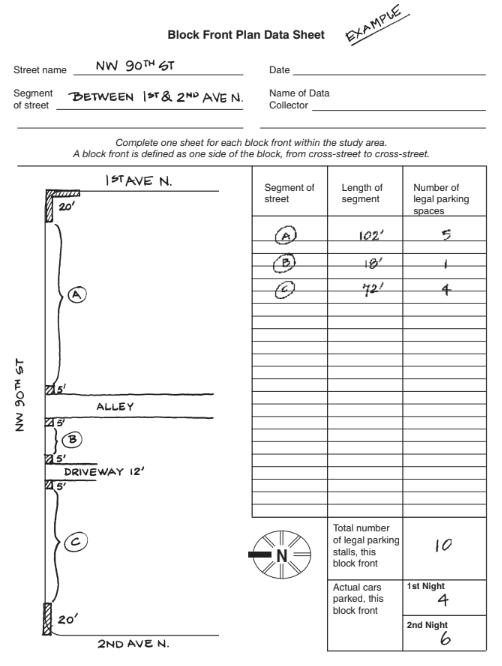
I didn't finish on day one. I came back several more times, until I had a very large stack of marked-up paper, and a whole separate phase of work still ahead, converting every hand-drawn segment into a parking-space estimate. The calculations alone took more than 40 hours. After we sent the results to the client, they came back with a long list of corrections. That meant going back through the field sheets, revisiting the measurements, and redoing the calculations. The work had already taken days, and now there was another round to get through.
Walking those blocks also taught me how much judgment goes into an inventory: how curb paint fades and becomes difficult to distinguish, how often signs contradict what's written down, or how a block face that looks like a five-minute job turns into twenty. Those experiences helped shape the tools and review processes I would work on later.
Letting Excel do the math
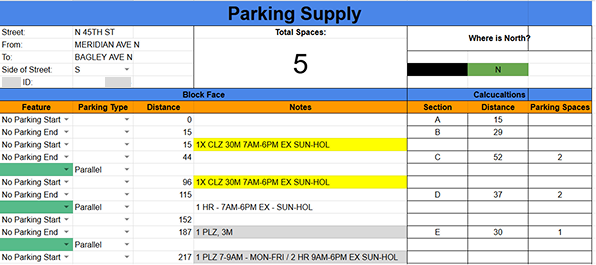
After that first Seattle project, I decided I would never do those calculations by hand again. So, I built an Excel spreadsheet. Nothing sophisticated, just a tool that let someone enter curb segment measurements, display the block face, and get an automatic parking-space estimate.
But it didn’t solve the whole problem. The math was faster and more consistent, but we still had to transfer our field measurements into the spreadsheet and then turn the results into a map. It made more sense to bring the mapping and calculations together.
Giving the curb a digital home
When I joined DIXON in 2021, we started mapping curb segments and calculating inventory directly in GIS, using street-level and aerial imagery to reduce fieldwork. Measurements, calculated space estimates and counts, and regulations could now live together on the map.
Getting the information onto the map was one step. Organizing complex curb rules was another, especially when cities’ existing inventories described them in different ways. The Open Mobility Foundation’s Curb Data Specification, or CDS, gave us a common structure to use in our curb mapping tools.
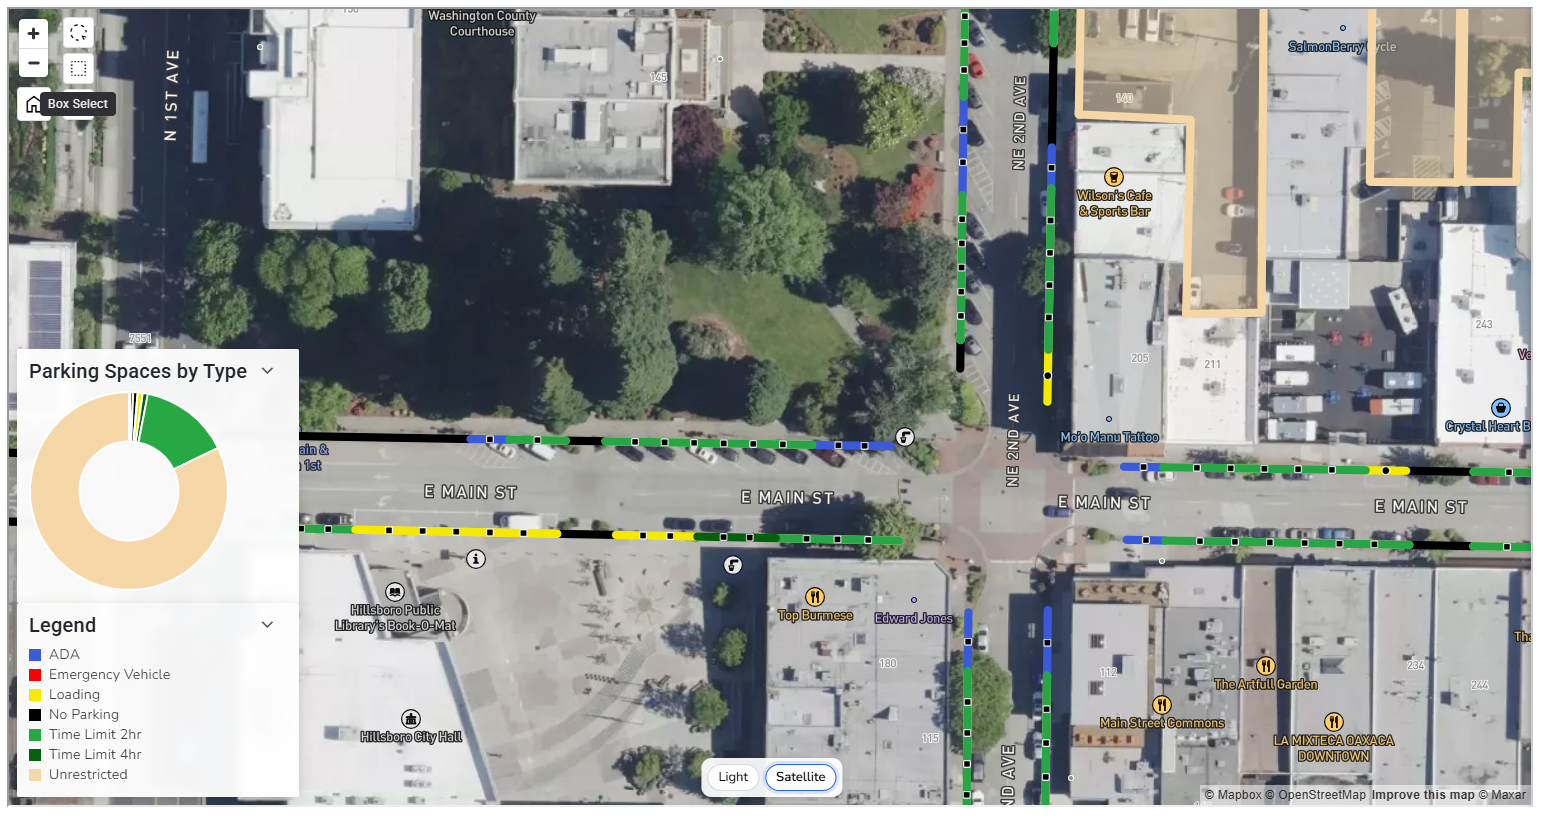
Now we can update the inventory as things change, so the next study doesn’t have to start from scratch. That means less repeat fieldwork and lower costs.
Knowing what was available was only the start. Next came understanding how people used it.
Next in the series: From Clipboards to Cameras.
Contact us today to explore how DIXON can help you achieve your goals with innovative, customized solutions.

.svg)
.svg)
